Select Page

OVERVIEW

<iframe width="560" height="315" src="https://www.youtube.com/embed/InJMdJ5_DkM?rel=0&showinfo=0" frameborder="0" allowfullscreen></iframe>

BACKGROUND

<iframe src="https://www.google.com/maps/d/u/0/embed?mid=1jdMck6z7D18c_aci1mRe0R3ZSc0" width="640" height="350"></iframe>

Objective

This project aims to create a simulation tool which allows alternative resourcing and booking models to be analysed. We aim to provide insight for executive strategy and resource allocation decisions.

Scale

Waitemata District Health Board is the largest DHB in New Zealand by population. It provides services for 600,000 people and performs 175,000 radiology procedures every year.

Growth

Demand growth puts significant strain on radiology services. The Northern Regional Alliance predicts that population will continue to grow at a higher rate than any other DHB. Further strain is put on the system by the post-retirement demographic, which is predicted to grow by a further 21.8% in the next 5 years [1].

Outsourcing

Currently the DHB is over capacity, and outsources 420 radiology procedures per year. To meet processing targets, patients are diverted to private providers or are scanned outside of standard hours. This places a financial burden on the DHB and, hence, on the national health system as a whole.

SIMULATION

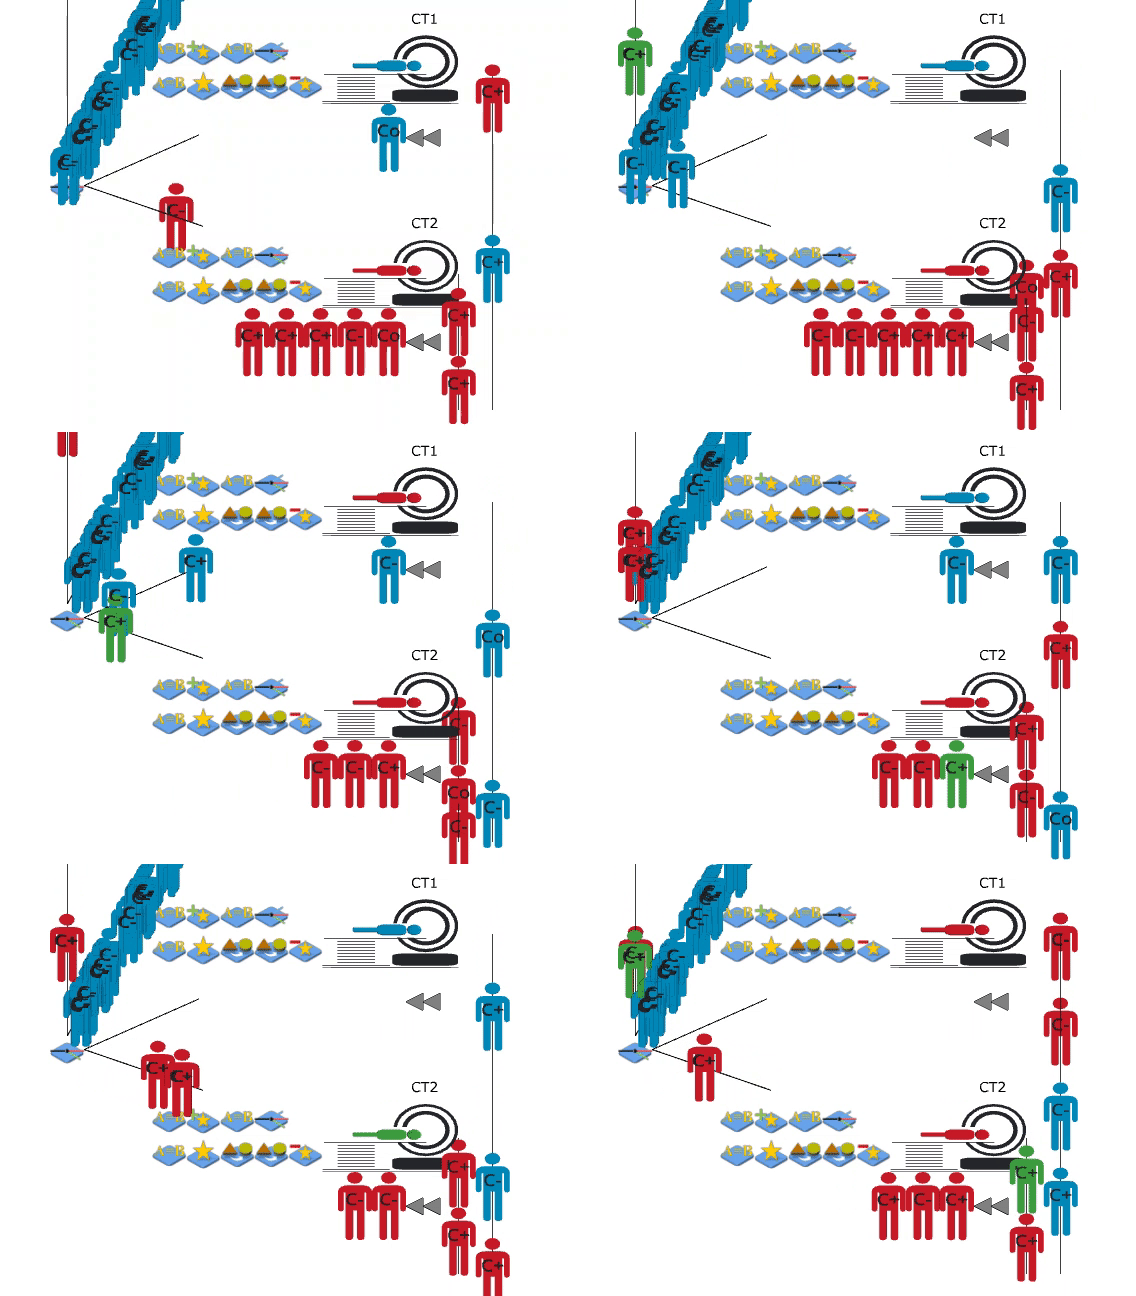
Key:


Arrival

Data Science

Historical patient data was provided by the North Shore Hospital. This required four-stages of pre-processing to fix errors and to add randomness before being used in the simulation.

1. Machine Learning

Historical patient data was provided by the North Shore Hospital. 13% of the 40,000 patient records were missing the time of arrival. Anomaly detection and imputation of missing values was conducted in Python.

We developed a two stage machine learning pipeline:
1. Classification
Patient arrival times were found to be bimodal. 40% entered the system less than one day before their scan, and 60% arrived more than a day prior. This is likely due to emergency patients requiring near-immediate scans, and outpatients being assigned a booking slot within the next six weeks.
2. Prediction
A gradient boosting regressor was used to identify the features of interest within the data set. A random forest machine learning pipeline was trained and used to predict the missing arrival times.

The machine learning pipeline was able to predict inpatient/emergency arrival times to within 9 hours, and outpatients within 24 hours.

2. Generating Random Patient Data

Random data sets were generated using a bootstrapping method, in R. This allowed multiple runs to be performed, while preserving historical distributions of arrival time of day and week. Through this method we generated:

  • Longer runs
  • Multiple runs with randomness
  • Forecasted arrivals according to estimated population growth
3. Exporting


Using Visual Basics for Applications, data was reformatted and placed into ‘.inc’ files that could be read into JaamSim. Anomalies in scan durations were detected and corrected during the export.

4. Importing


The model was built in JaamSim, a Java-based Discrete Event Simulation package. Data was read into the program, and used to generate patients with seven defining characteristics. The characteristics included priority, scan duration, and whether the patient would arrive on time.

Priority Queues

A customised JaamSim package was created to implement complex queueing logic. The source code was downloaded from GitHub, and object classes were extended to add custom functionality.

Patients requiring scans within two or six hours join priority queues. Patients in these queues have precedence over booked patients (below) and are able to queue for both CT scanners simultaneously.

After communication with JaamSim’s curator, Dr. Harry King, the custom functionality was added into the standard JaamSim package.

Booking

The booking process was the focus of the simulation model. In order to learn the current system, a series of meetings were conducted with booking clerks at the North Shore Hospital. The existing process was then converted into a conceptual model; the project aims and simplifications to the model logic were noted. The conceptual model was used to inform the construction of the simulation, and to communicate the booking logic to those not familiar with code.

A simplification was made in the conceptual model, where emergency and inpatients are scanned in order of priority. Only (blue) outpatients are assigned a booking slot. They reach the scanning process at their appointment time, which can be any time from immediately to six-weeks later.

Scanning

The scanning process was modeled, including the flow of both emergency and inpatients. Even though these patients bypassed the booking process, they interact with outpatients by competing for scanners.

The model was validated using historical arrival data. The simulation outputs (patient waiting time and rate of patients outsourced) were compared to historical performance. Adjustments were made to the simulation until a satisfactory fit had been achieved. For example, queueing times in the simulation were found to be far shorter than historical data suggested. Through consultation with booking clerks we discerned that the scan duration data did not account for the time taken to load patients into the machine. Loading time was incorporated by modification of scan durations by a linear function. This modification made the simulation queue durations increase to accurately reflect the historical distribution.
RESULTS

Forecasting

The simulation was used to predict future performance. Population growth estimates [2] were used to increase the rate of patient arrival. 20 simulation runs of one six-week duration were used to predict outsourcing and queueing times. We found that under current resourcing, average wait duration will increase by 125% and outsourcing rates will increase by 46% over the next 15 years. Rate of wait duration decreases over time as more of the additional arrivals are outsourced.

<html><!-- [et_pb_line_break_holder] --><head><!-- [et_pb_line_break_holder] --> <script src="https://cdn.plot.ly/plotly-latest.min.js"></script><!-- [et_pb_line_break_holder] --></head><!-- [et_pb_line_break_holder] --><body><!-- [et_pb_line_break_holder] --> <div id="tester2" style="width:600px;height:400px;"></div><!-- [et_pb_line_break_holder] --><script><!-- [et_pb_line_break_holder] --> TESTER2 = document.getElementById('tester2');<!-- [et_pb_line_break_holder] -->Plotly.plot(TESTER2, {<!-- [et_pb_line_break_holder] --> data: [{"autobinx": true, "uid": "d7f654", "ysrc": "charlienorton:0:e11396", "xsrc": "charlienorton:0:c2fd40", "name": "Waiting Times", "marker": {"cauto": true, "cmax": 7, "cmin": 1, "colorscale": [[0, "rgb(220,220,220)"], [0.2, "rgb(220,220,220)"], [0.4, "rgb(220,220,220)"], [1, "rgb(220,220,220)"]]}, "mode": "lines", "y": ["Average Waiting Time", "25", "45", "52", "58"], "x": ["Year", "2016", "2021", "2026", "2031"], "type": "scatter", "autobiny": true}, {"autobinx": true, "uid": "207917", "ysrc": "charlienorton:0:e11396", "xsrc": "charlienorton:0:c2fd40", "name": "95% Confidence", "mode": "markers", "y": ["Average Waiting Time", "25", "45", "52", "58"], "x": ["Year", "2016", "2021", "2026", "2031"], "autobiny": true, "type": "scatter", "error_y": {"array": ["Error Low", "2.9", "6.5", "5.9", "7.1"], "arraysrc": "charlienorton:0:884c15"}}],<!-- [et_pb_line_break_holder] --> layout: {"showlegend": false, "yaxis": {"range": [0, 70], "type": "linear", "autorange": false, "title": "Average Waiting Time (Mins)"}, "title": "Predicted Waiting Times", "autosize": true, "breakpoints": [], "xaxis": {"range": [2015.0745245466608, 2031.9254754533392], "type": "linear", "autorange": true, "title": "Year"}, "hovermode": "closest"},<!-- [et_pb_line_break_holder] --> frames: [],<!-- [et_pb_line_break_holder] --> config: {"mapboxAccessToken": "pk.eyJ1IjoiY2hyaWRkeXAiLCJhIjoiY2lxMnVvdm5iMDA4dnhsbTQ5aHJzcGs0MyJ9.X9o_rzNLNesDxdra4neC_A", "linkText": "Export to plot.ly", "showLink": false}<!-- [et_pb_line_break_holder] --> });<!-- [et_pb_line_break_holder] --></script><!-- [et_pb_line_break_holder] --></body><!-- [et_pb_line_break_holder] --></html><!-- [et_pb_line_break_holder] --><!-- [et_pb_line_break_holder] -->
<html><!-- [et_pb_line_break_holder] --><head><!-- [et_pb_line_break_holder] --> <script src="https://cdn.plot.ly/plotly-latest.min.js"></script><!-- [et_pb_line_break_holder] --></head><!-- [et_pb_line_break_holder] --><body><!-- [et_pb_line_break_holder] --> <div id="tester" style="width:600px;height:400px;"></div><!-- [et_pb_line_break_holder] --><script><!-- [et_pb_line_break_holder] --> TESTER = document.getElementById('tester');<!-- [et_pb_line_break_holder] -->Plotly.plot(TESTER, {<!-- [et_pb_line_break_holder] --> data: [{"autobinx": true, "uid": "d7f654", "ysrc": "charlienorton:0:e11396", "xsrc": "charlienorton:0:c2fd40", "name": "Number of Patients Outsourced", "marker": {"cauto": true, "cmax": 7, "cmin": 1, "colorscale": [[0, "rgb(220,220,220)"], [0.2, "rgb(220,220,220)"], [0.4, "rgb(220,220,220)"], [1, "rgb(220,220,220)"]]}, "mode": "lines", "y": ["Number Outsourced", "31.4", "35", "37.4", "45.7"], "x": ["Year", "2016", "2021", "2026", "2031"], "type": "scatter", "autobiny": true}, {"autobinx": true, "uid": "207917", "ysrc": "charlienorton:0:e11396", "xsrc": "charlienorton:0:c2fd40", "name": "95% Confidence", "mode": "markers", "y": ["Number Outsourced","31.4", "35", "37.4", "45.7"], "x": ["Year", "2016", "2021", "2026", "2031"], "autobiny": true, "type": "scatter", "error_y": {"array": ["Error Low", "7", "8", "7", "6"], "arraysrc": "charlienorton:0:884c15"}}],<!-- [et_pb_line_break_holder] --> layout: {"showlegend": false, "yaxis": {"range": [0, 52.44444444444444], "type": "linear", "autorange": false, "title": "Patients Outsourced\/Month"}, "title": "Predicted Outsourcing", "autosize": true, "breakpoints": [], "xaxis": {"range": [2015.0745245466608, 2031.9254754533392], "type": "linear", "autorange": true, "title": "Year"}, "hovermode": "closest"},<!-- [et_pb_line_break_holder] --> frames: [],<!-- [et_pb_line_break_holder] --> config: {"mapboxAccessToken": "pk.eyJ1IjoiY2hyaWRkeXAiLCJhIjoiY2lxMnVvdm5iMDA4dnhsbTQ5aHJzcGs0MyJ9.X9o_rzNLNesDxdra4neC_A", "linkText": "Export to plot.ly", "showLink": false}<!-- [et_pb_line_break_holder] --> });<!-- [et_pb_line_break_holder] --></script><!-- [et_pb_line_break_holder] --></body><!-- [et_pb_line_break_holder] --></html><!-- [et_pb_line_break_holder] --><!-- [et_pb_line_break_holder] -->

Improvements

Percentage of Patients Scanned Within their Target Time Frame
Target time frame is based on patient priority and is noted above each bar.

  • 2hr 100% 100%
  • 6hr 99.99% 99.99%
  • 24hr 83.88% 83.88%
  • 48hr 88.18% 88.18%
  • 1 Week 92.39% 92.39%
  • 2 Weeks 97.75% 97.75%
  • 6 Weeks 100% 100%
  • TOTAL 97.05% 97.05%

Analysis of the number of patients scanned within their target timeframe showed that 24hr priority patients were the least likely to meet their target. Instead many were being outsourced to private providers.

An additional slot was added to the booking sheet at the end of each day, reserved for 24hr priority patients. This extended the scanning hours from 3:50pm to 4:00pm.


The new policy was tested using the simulation model. We determined that the addition of an extra slot on the booking sheet reduced outsourcing rates significantly, with no significant effect on the average waiting times.

%

Fewer Patients Outsourced/Month

No

Increase in Wait Times

Charles Norton

Charles Norton

Engineering Science Student

Associate Prof. Cameron Walker

Associate Prof. Cameron Walker

Supervisor

Dr. Michael O'Sullivan

Dr. Michael O'Sullivan

Supervisor

REFERENCES

[1] Waitemata District Health Board. About DHBs.http://www.waitematadhb.govt.nz/about-us/about-dhbs/, 2016. [Online; accessed 26-August-2017].
[2] Statistics New Zealand. Subnational Population Projections: 2013(base)-2043 update. http://www.stats.govt.nz/browse_for_stats/population/estimates_and_projections/SubnationalPopulationProjections_HOTP2013base-2043/Tables.aspx, 2017. [Online; accessed 13-September-2017].