Supply Chain Management for BBBYO
Introduction
BBBYO supply high grade water bottles to customers in Australia through two sales channels:
- Business to customer (B2C) — They are individual customers buying from the BBBYO who usually buy one bottle at time;
- Business to business (B2B) — They are companies who resell BBBYO’s bottles who usually buy in bulk.
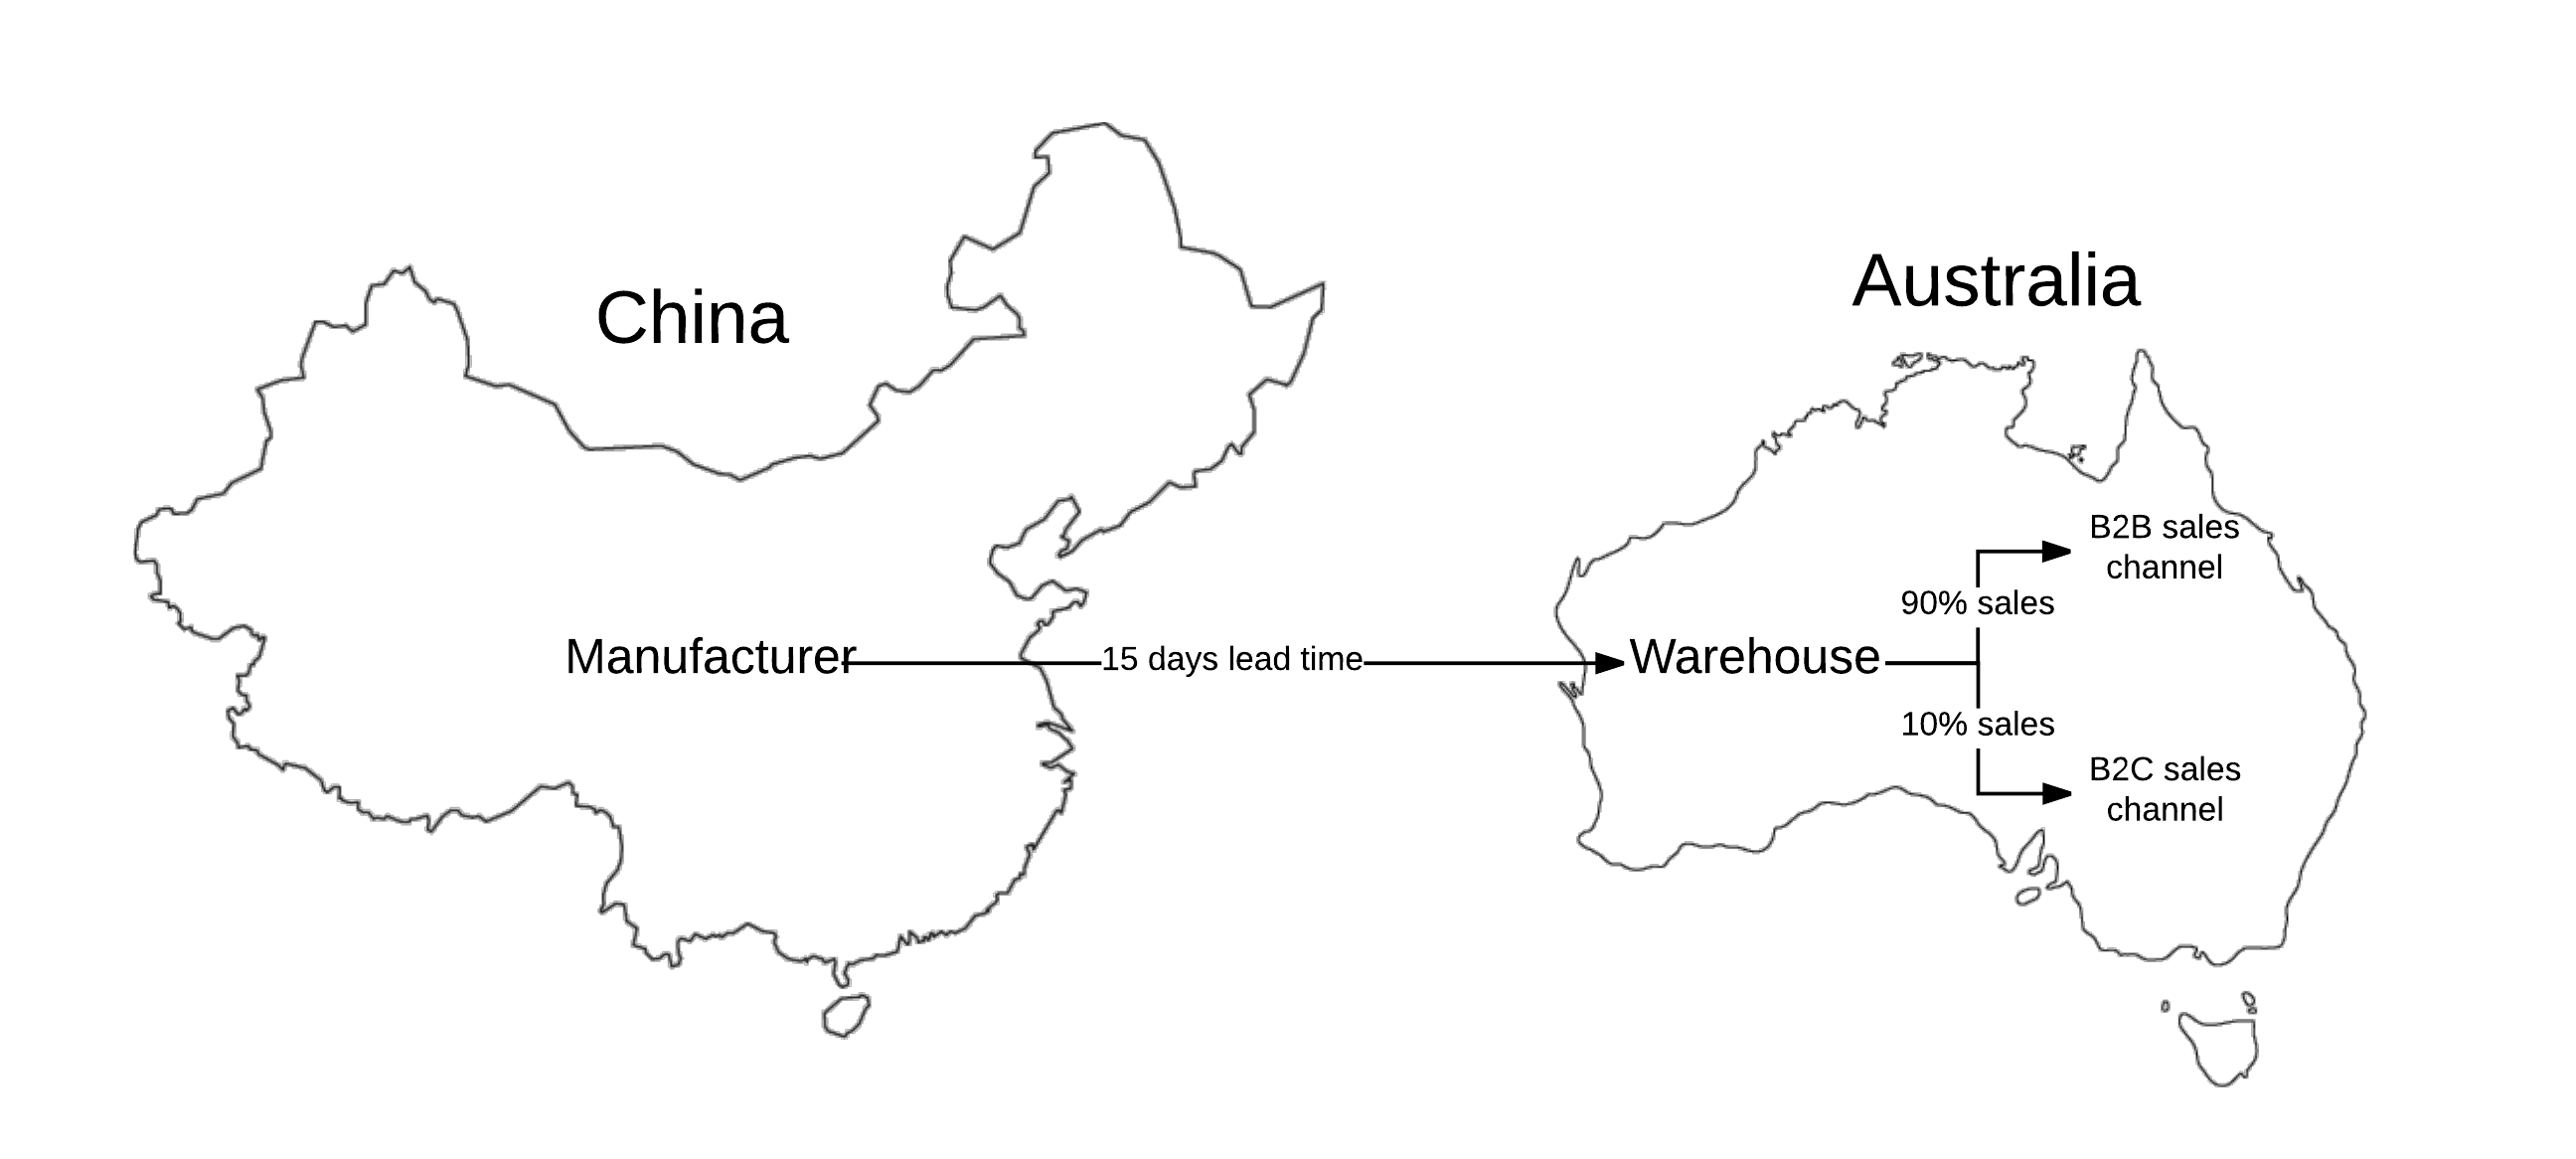
The Supply Chain Diagram for BBBYO
Customers do not want to wait 2-3 weeks for their bottle to arrive, so the warehouse in Australia holds stock for quick delivery of orders. The aim of this project is then to find the optimal order policy such that the warehouse is sufficiently stocked so it does not run out of stock or have excess stock, incurring unneeded costs.
The order policy is made up of:
- Reorder point — The stock level at which to reorder more stock;
- Order quantity — The amount of stock to reorder at one time.
Demand Process
To build a reliable model, we need to accurately estimate the sale bottles. The demand process is split between B2C and B2B. Each sales channel has three key processes:
- Sales amount — Number of sales per order;
- Order amount — Number of orders per day;
- Time between orders — Number of days between orders.
Using histogram plots the distribution of each process could be found. These distributions can be used to approximate demand for each day.
B2B sales channels
B2C sales channel
Simulation
To optimize the order policy, stock levels need to be monitored and evaluated. To do this a realistic example of the changes in stock level needs to be produced. Using the demand processes from above we can replicate actual demand. Then, the stock levels can be calculated each day based on the estimated demand for each day. We can then evaluate different order policies based on the total cost and the amount (if any) of missed sales. The Economic order quantity (EOQ) model can be used to show this initially using constant demand.

Modelling
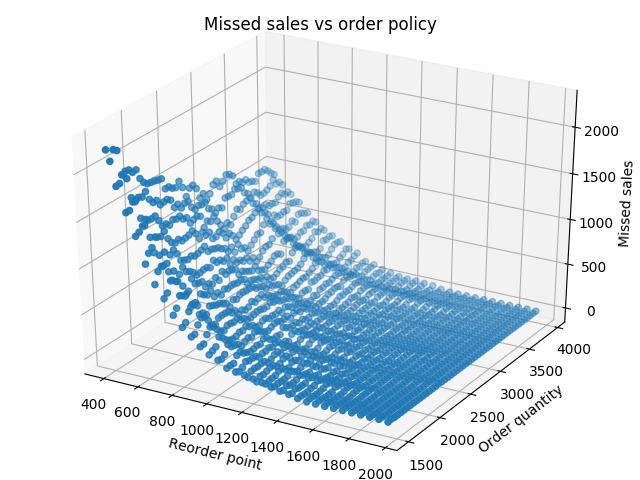
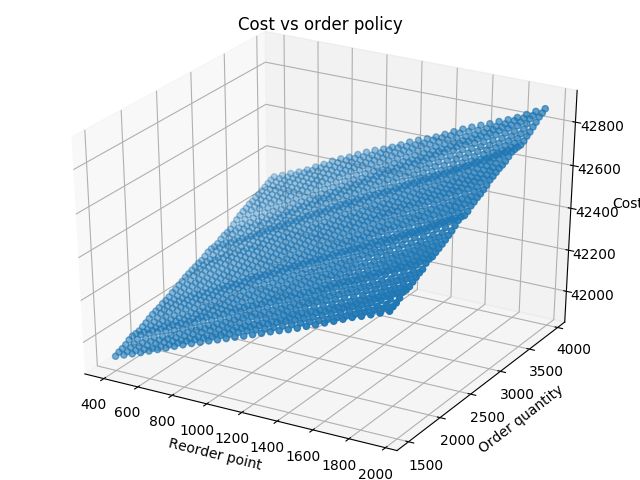
To evaluate an order policy, 100 simulations were run with randomly generated outputs from the demand distributions while keeping the same reorder point and order quantity. The missed sales and total cost were saved after each run and then averaged over the 100 runs. This was repeated for differing order policies. The range of the order quantity was from 1500 to 3950 increasing in 50 bottles each policy. The reorder point ranged from 400 to 1950, also in steps of 50. The order policies tried, included every combination of these ranges totaling to 1600 tried policies. The graphs show the cost for the order policies and the missed sales for each policy.
Results
From the simulation described, the average total cost and missed sales for each order policy are plotted together. BBBYO would like to minimize both cost and missed sales so the better order policies tend towards the bottom left corner of the graph. The set of the better order policies is shown by the green line. Any point on this line is an order policy that has a smaller cost or number of missed sales then every other point on the graph. Furthermore, the points on this line are all order policies which BBBYO could use as order policies. The red line includes all of the order policies with no missed sales. The lowest cost, no missed sales order policy is a reorder point of 1650 and an order quantity of 1700 and would be my recommended order policy for BBBYO.

Supervisors: Dr. Michael O’Sullivan and Dr. Cameron Walker.
Produced by Tim Bennetts as part of a fourth year project under the Department of Engineering Science at the University of Auckland.


