Introduction
Auckland Council’s vision is to make Auckland the world’s most liveable city. The community facilities including open spaces (e.g. parks and playgrounds) and community facilities (e.g. libraries and leisure centres) make significant contributions to people’s quality of life, and therefore are integral to achieve the vision. Auckland Council’s Community Facilities department is responsible for ensuring these facilities operate efficiently and effectively to support the Council’s services today and for generations to come. The newly formed Investigation and Design (I&D) unit of the Community Facilities department leads the initial planning, investigation, and design around the requirements for the facilities.
Objective
The objective of the project is to assist the Community Facilities I&D unit to establish a rolling prioritised programme for their projects over the next three years. This involves:
Visualisation
Develop methods to visualise the proposed projects.
Prioritisation
Build and solve mathematical models to prioritise the proposed projects over the next three years to maximise benefits while meeting constraints.
Data
The data was obtained from Auckland Council.
The Projects sheet provides a list of proposed growth and renewal community facilities projects. Each project has various features including priority score, priority level, local board, area, hyperion code representing an asset class, total project cost estimate, and project cost estimates for different financial years.
The Budgets sheet provides the three-year budgets for different asset classes. The budgets for each asset class are then allocated to the individual local boards. The budgets will provide the funds for the proposed projects.
The data is cleaned to fix inconsistent data, which includes errors, missing values, and duplicated data. A SQLite database is used to store the data from the Projects and Budgets sheets. This allows us to access the data in various ways and provides us the ability to manipulate the data with ease.
PROPOSED PROJECTS
MILLION DOLLARS OF BUDGET OVER THE NEXT THREE YEARS
Visualisation
Interactive Map
The map is created to show the proposed projects in Auckland filtered by financial year and asset class. For example, if the user selects the financial year FY17/18 and the asset class Parks – Assets Renewals, the map would show the projects that belong to the Parks – Assets Renewal asset class that have project cost estimate in the 17/18 financial year.
The user can zoom in and expand a cluster to see the individual projects within a local board. The size of the circle represents the amount of project cost estimate. The colour of the circle represents the project’s priority score, with decreasing priority going from red to green, and black means the project does not have a priority score. A brief project description is provided when the user clicks an individual circle.
Notes:
- Regional projects are not shown as they do not belong to a specific local board.
- A blank canvas is shown when certain combinations of financial year and asset class do not contain any projects.

Facet Grids:
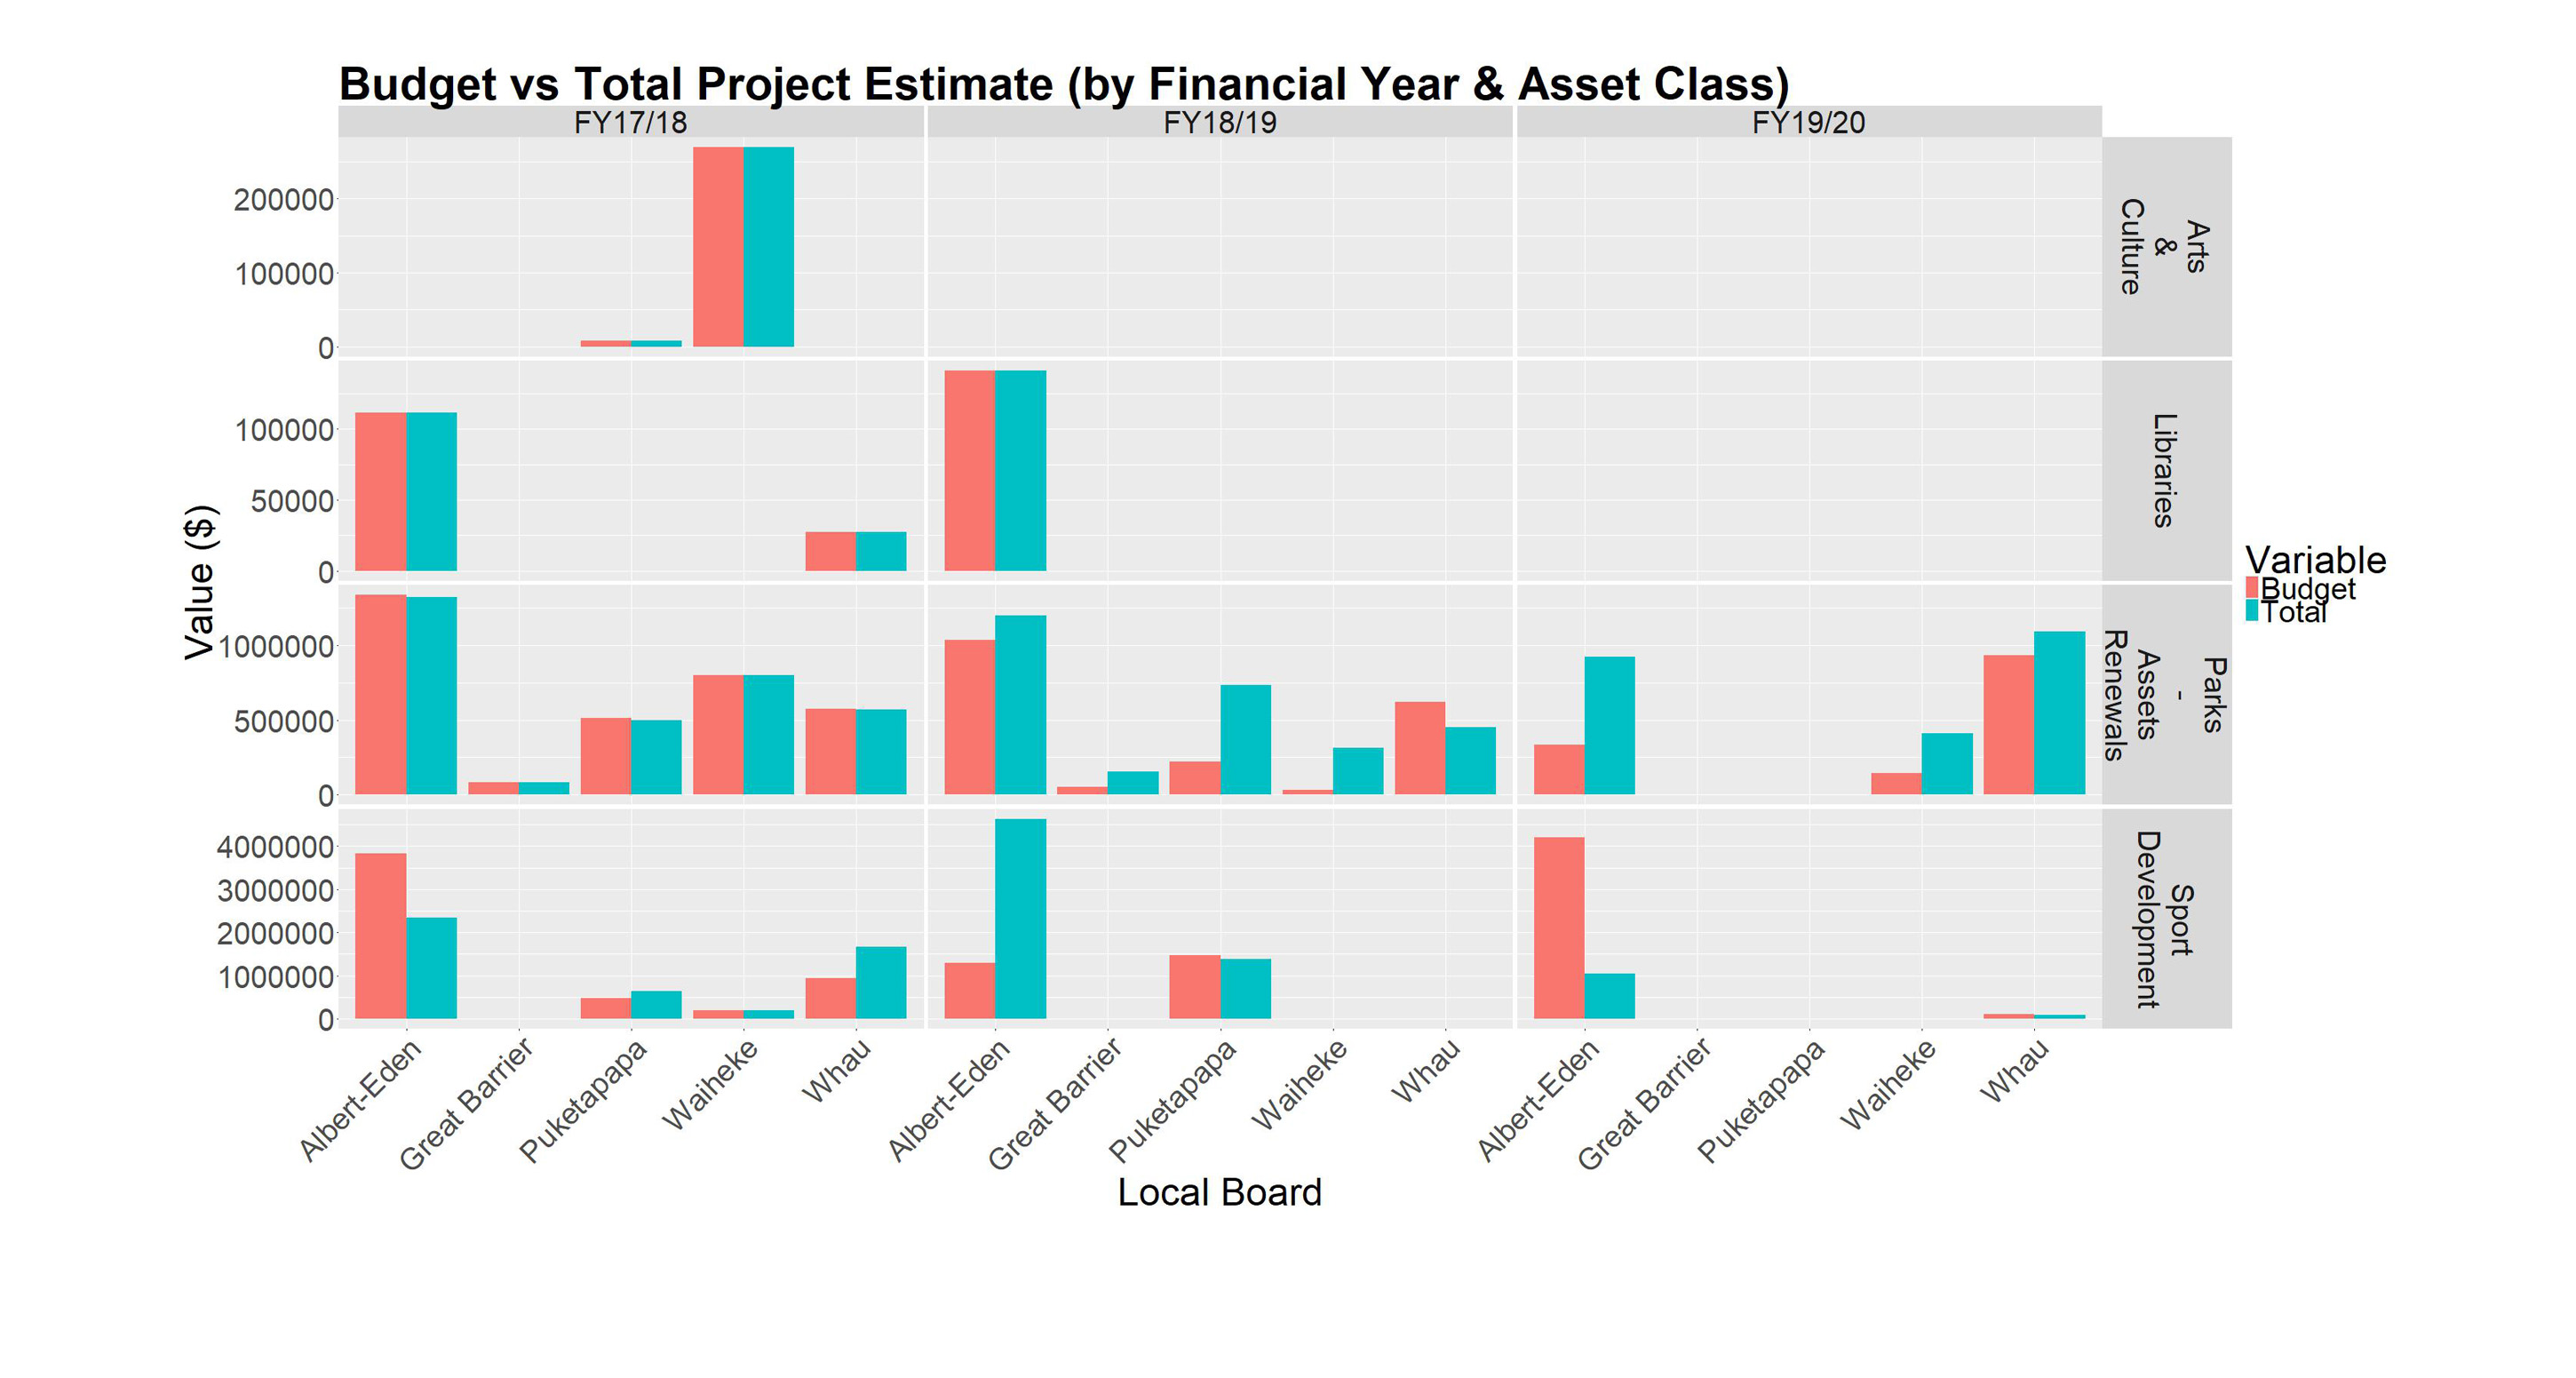
Facet grids are created to compare the project cost estimates with the budgets. Faceting variables including financial year, asset class and area are used to split up the data set. This gives Auckland Council the ability to see how their planned spendings differ from the budgets for different combinations of the faceting variables.
For political reasons, Auckland Council would like to monitor inequities in the expenditure over the five Auckland areas. The second grid that uses area and asset class as the faceting variables can help Auckland Council to plan where the funds will be spent in the future.
From the grids on the left, we can see that most project cost estimates align with the budgets for the Arts & Culture and the Libraries asset classes but there are a lot of disparities for the Parks – Assets Renewals and Sport Development asset classes.
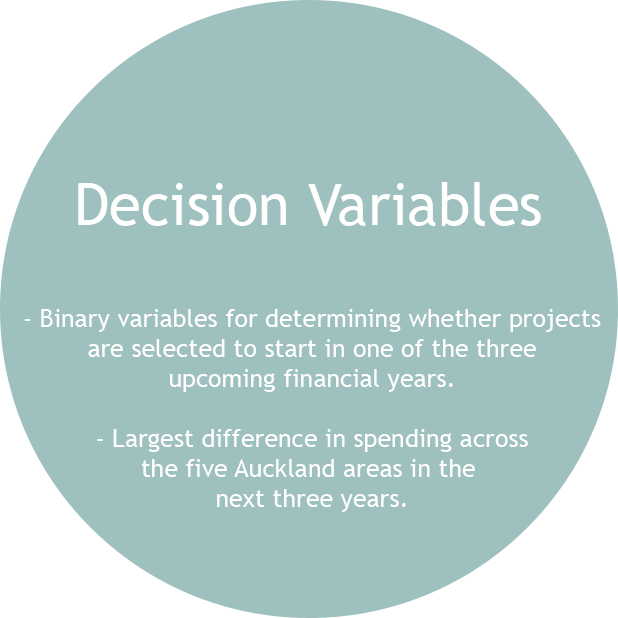
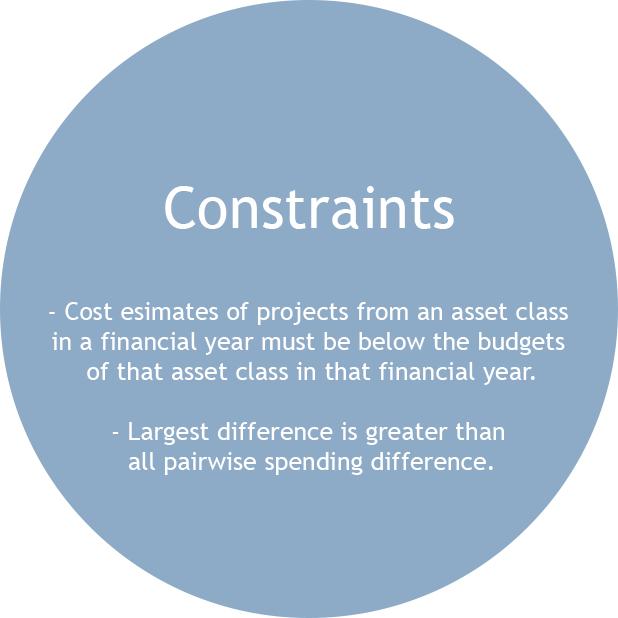
Model
A preliminary single objective integer programming model is first developed. This model maximises the sum of the projects’ priority score while respecting various budgets for each fi nancial year and asset class. The model uses binary decision variables to determine whether projects are selected for implementation.
A more advanced bi-objective model is developed after additional information has been obtained from Auckland Council. This is described below.
Formulation

Methods
Since we are trading off between the two objectives, we seek to identify a set of efficient solutions, which can be candidates for the final solution. A solution is efficient when one objective value cannot be improved without worsening the other objective value.
Firstly, the weighted sum method is used for the initial exploration of the solutions. The weighted sum method transforms the two objectives into one single objective by multiplying each objective with a predefi ned weight. It allows us to identify the maximum and minimum values of each objective so we can apply the epsilon-constraint method.
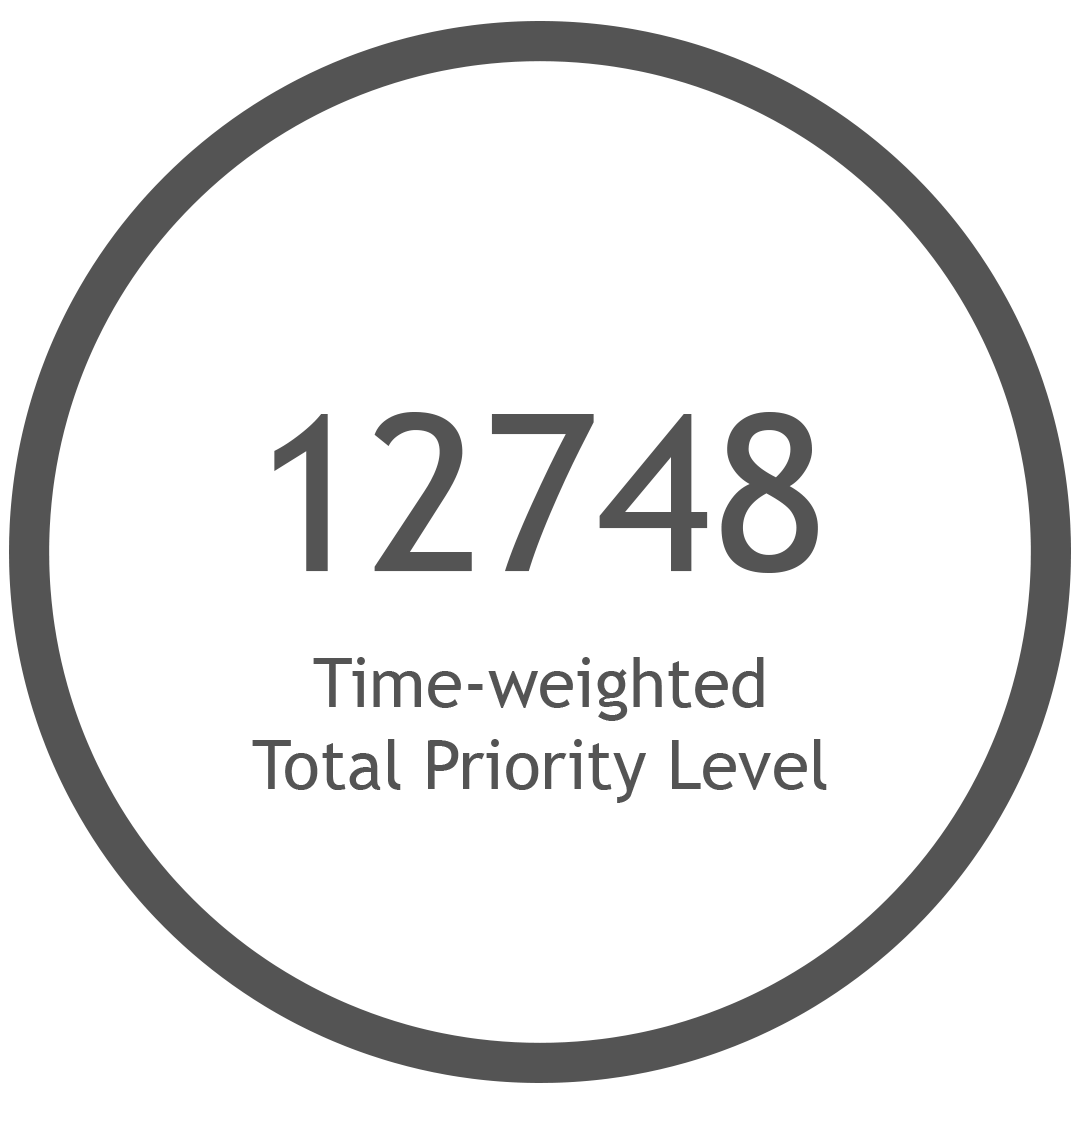
Using the epsilon-constraint method, we focus on maximising the time-weighted total priority level objective, and express the largest difference objective as an inequality constraint. The largest difference value is initially restricted to the maximum largest difference value found while solving with the weighted sum method. Then it is further restricted in steps of 100,000 as we solve the problem iteratively. A set of efficient solution is produced.
Solver:
![]()
Results
The interactive efficient frontier graph shows the 52 different candidate solutions that Auckland Council can select as their final solution depending on their perceived importance of the two objectives.
- As we maximise the time-weighted total priority level objective, the largest difference objective increases (worsens).
- As we maximise the time-weighted total priority level, more projects are being selected in total and more projects are being selected to start earlier.
- There are two jumps in the largest difference value. This is because of some costly projects’ starting times are being shifted. If a project starts later than FY17/18, only a part of the its total project estimate contributes to the spending since we are considering the spending in the next three years.
Recommended Solution
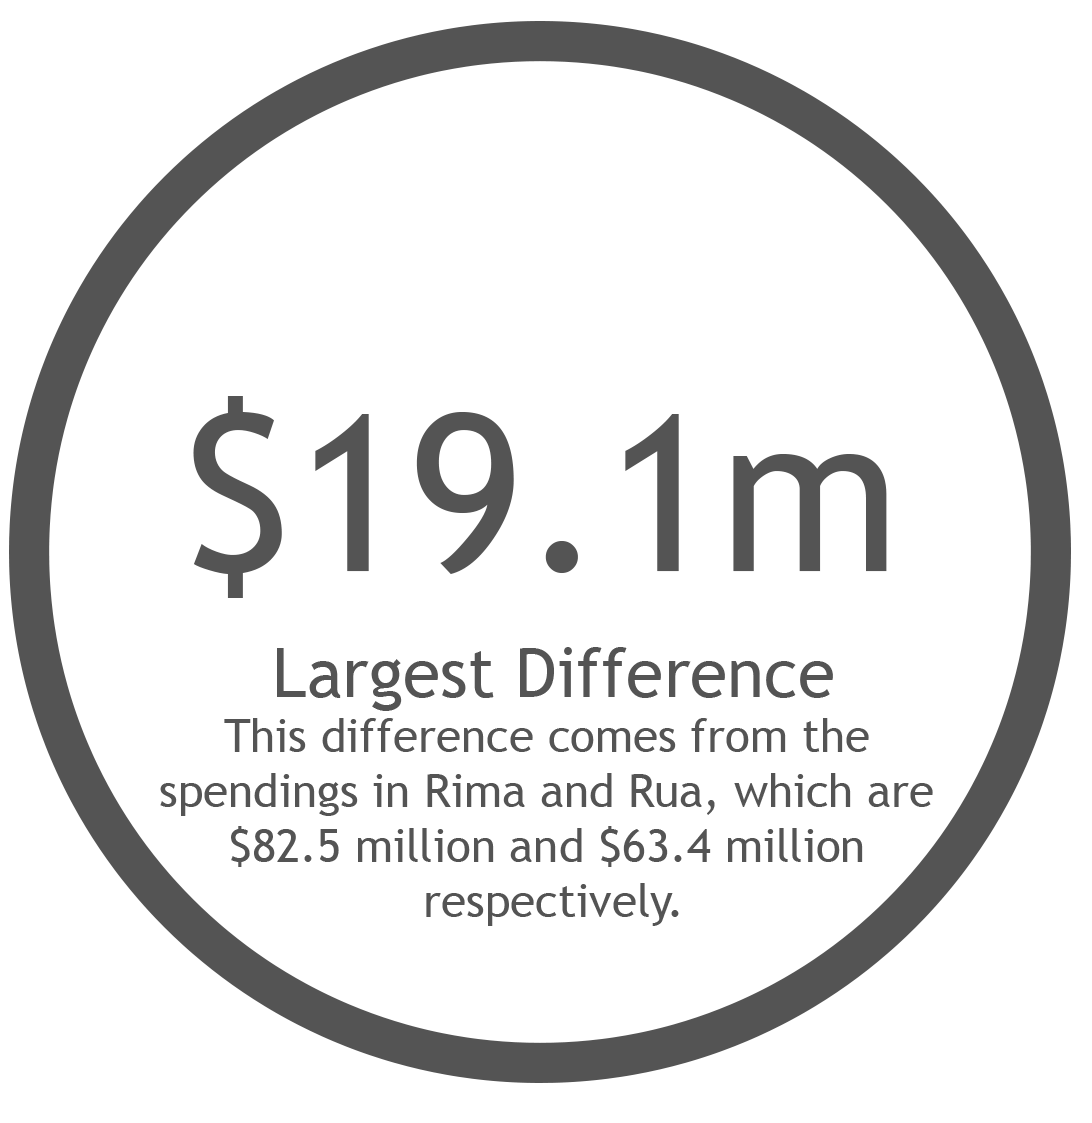
Auckland Council stated an additional requirement for the largest difference in spending to be capped at $20 million. This leads to a recommended solution.
Four projects have been declined:
- 108: Auckland Domain Nursery Depot – Glass Houses Replacement/Renewal.
- 321: Eugenia Rise Reserve – develop neighbourhood playground.
- 446: Hayman Park Stage 1 – develop park.
- 576: Jack Lachlan Drive – develop playground.
Projects Selected
Projects Starting in FY17/18
Projects Starting in FY18/19
Projects Starting in FY19/20
The recommended solution can be visualised through the interactive map.
Notes:
- Regional projects are not shown as they do not belong to a specific local board.
- The colour of each circle represents the project’s priority level, with red for a priority level of 3, yellow for a priority level of 2, and green for a priority level of 1.
By Cheryl Jiang
Supervised by Dr. Michael O’Sullivan, Dr. Cameron Walker & Dr. Andrea Raith
Department of Engineering Science